Revenue Per Employee: The Key Metric for Scaling
Cashflow & Payroll

Jan 6, 2026
Use Revenue Per Employee to avoid risky hires, protect margins, and make data-driven staffing and pricing decisions for payroll-heavy agencies.
If your agency doesn't track Revenue Per Employee (RPE), you're scaling blind. Most founders focus on revenue and profit, but these metrics alone won’t protect you from the financial risks tied to payroll-heavy growth. RPE is the clearest indicator of whether your team structure and pricing can support sustainable scaling - or if you're just adding headcount to stay busy.
Hiring feels risky because it is. Every new employee creates a financial drag before they contribute, and without RPE as a guide, you risk overstaffing or underpricing. Agencies with high payroll exposure often find themselves squeezed: cash feels tighter than revenue suggests, and margins erode as growth introduces inefficiencies.
This article shows you how to use RPE as a decision-making tool, not just a number. You’ll learn:
Why RPE connects directly to labor efficiency and profitability.
How to calculate RPE accurately for payroll-heavy agencies.
The benchmarks and thresholds that signal when to hire - or when to pause.
Practical steps to improve RPE through pricing, utilization, and team structure.
Scaling isn’t about more people; it’s about better productivity per person. Let’s dive into how RPE protects your margins while giving you control over growth decisions.
Understanding Revenue Per Employee: The Basics
Grasping the role of Revenue Per Employee (RPE) is essential for agency founders looking to scale effectively. At its core, RPE measures the revenue generated per full-time team member. It acts as a critical benchmark, helping you determine whether your staffing aligns with your profit margin goals [3][5].
For agencies with significant payroll costs, RPE serves as an early diagnostic tool. It can highlight if you're expanding your team too quickly, underpricing your services, or assigning labor to tasks that don't justify their expense. Without this metric, hiring and pricing decisions are often made on instinct rather than grounded in financial realities.
The Revenue Per Employee Formula
The formula itself is simple:
RPE = Total Revenue ÷ Number of Employees (FTEs)
For instance, if your agency generates $5,000,000 in revenue and has 30 full-time employees, your RPE would be $166,667.
However, for payroll-heavy agencies, this raw calculation can be misleading. Relying on gross revenue or an unadjusted headcount often paints an inaccurate picture of labor productivity.
Adjustments for Payroll-Heavy Agencies
To make RPE a practical and accurate tool, two key adjustments are necessary: focusing on Net Revenue and using Full-Time Equivalents (FTEs).
1. Use Net Revenue Instead of Gross Revenue
Agencies frequently handle pass-through costs - such as media spend, freelancer payments, software subscriptions, or supplier fees - that inflate gross revenue but don’t reflect the value created by your internal team. As Marcel Petitpas, a consultant specializing in agency profitability, notes:
By focusing on net revenue, overhead, and payroll, you'll get accurate numbers that keep your business profitable [3].
Net Revenue, often referred to as Agency Gross Income, strips out these pass-through costs, offering a clearer view of the income generated directly by your team.
2. Calculate FTEs, Not Raw Headcount
Instead of counting every individual on your payroll equally, adjust for part-time staff by calculating Full-Time Equivalents. For example, two part-time employees working 20 hours per week each would count as 1.0 FTE, not 2.0. This prevents part-time workers from artificially lowering your RPE [3]. Additionally, standard RPE calculations exclude contractors or outsourced labor, focusing solely on the productivity of your in-house team [2].
3. Use Average Headcount Over Time
Rather than using a snapshot of your team size at a single point, calculate the average headcount over the year. For instance, if you started the year with 25 employees and ended with 35, use 30 as your denominator [4]. This approach smooths out fluctuations caused by rapid hiring or turnover, providing a more accurate trend.
Metric Component | Definition for Agencies | Why It Matters |
|---|---|---|
Numerator | Net Revenue (Gross Revenue - Pass-throughs) | Reflects the actual value created by your team, excluding vendor-related costs [3]. |
Denominator | Full-Time Equivalents (FTEs) | Ensures part-time staff are proportionally accounted for, avoiding skewed results [3]. |
With these refinements, RPE becomes more than just a number - it evolves into a reliable margin indicator. It helps you assess whether your revenue-to-cost ratio supports your profit goals [3]. Armed with this data, you can make smarter decisions about hiring, pricing, and scaling, all while keeping profitability in focus.
Benchmarks and Target Metrics for Agencies
Revenue Per Employee Benchmarks and Target Metrics for Agencies
Once you've calculated your adjusted Revenue Per Employee (RPE), you can use it to gauge whether your agency's labor productivity is positioned for profitable growth. RPE isn't just a number - it informs staffing and pricing decisions, both of which are critical for scaling agencies effectively. For founder-led B2B agencies, understanding and applying these benchmarks is a key step toward sustainable success.
Industry Benchmarks for B2B Agencies
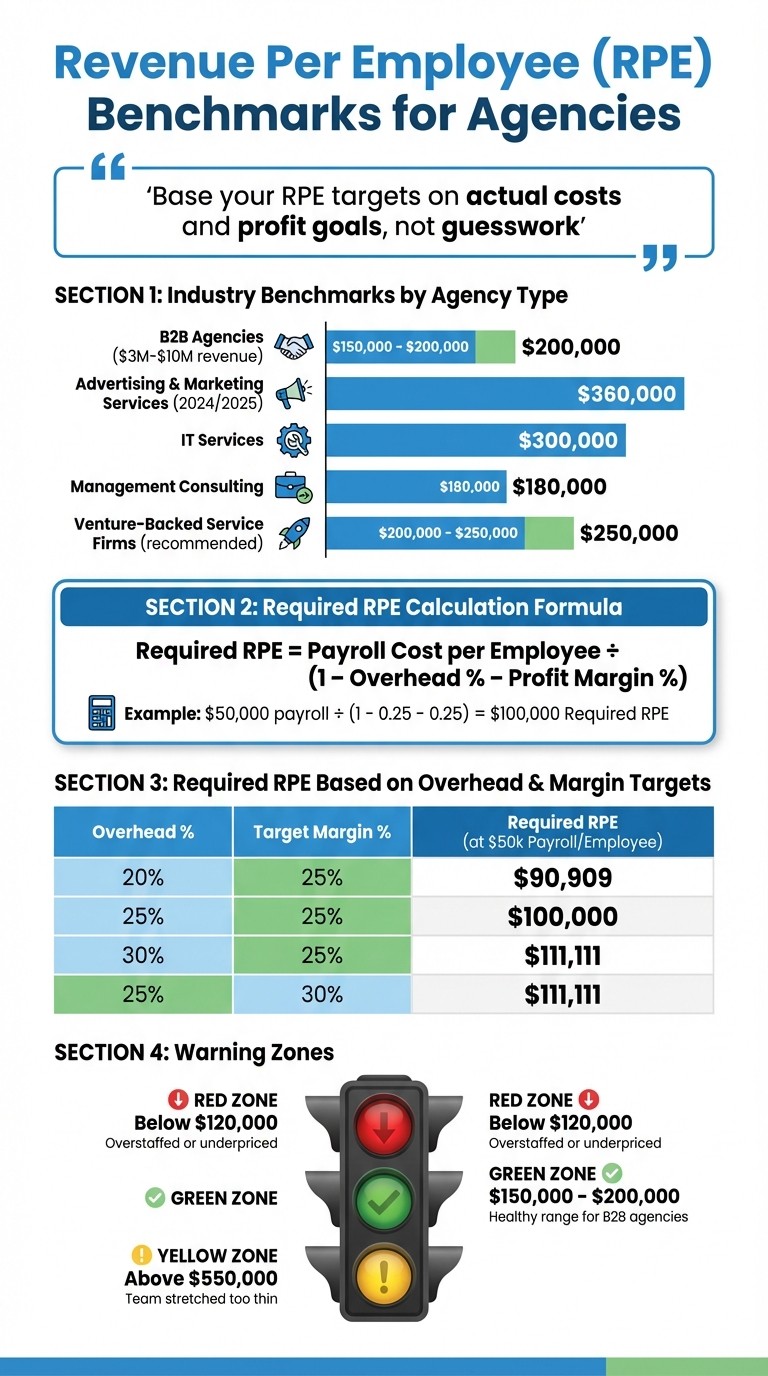
For agencies generating between $3 million and $10 million in annual revenue, an RPE target typically falls between $150,000 and $200,000 [5]. In the Advertising and Marketing Services sector, the 2024/2025 benchmark is $360,000 per employee [9]. This higher figure often reflects asset-light operations, which may not align with payroll-heavy agency structures. IT Services agencies, on the other hand, aim for around $300,000 [9], while Management Consulting firms average closer to $180,000 [9].
Jonathan Reynolds of Edison Partners provides additional context for venture-backed service firms, stating:
"I typically prefer to see more out of Edison's portfolio companies... the guidance I give is $200K–$250K" [8].
However, these benchmarks are only helpful if they align with your agency's unique cost structure and profit targets. For example, a creative agency operating with a 30% overhead rate and a 25% profit margin will need a different RPE than a lean consulting firm with 20% overhead and a 15% margin. These industry figures offer a starting point, but your agency's specific circumstances should dictate your target.
Setting Your Target RPE Based on Profit Margins
Rather than leaning solely on industry averages, you can calculate your Required RPE using this formula:
Required RPE = Payroll Cost per Employee ÷ (1 – Overhead % – Profit Margin %)
This approach ties your target directly to your costs and profit goals. Marcel Petitpas explains:
"This method bases your RPE targets on actual costs and your profit goals instead of guesswork or broad industry averages" [3].
Here's an example: If your average loaded payroll cost per employee is $50,000, with overhead at 25% of net revenue and a profit margin target of 25%, your Required RPE would be $100,000. If overhead increases to 30%, the Required RPE jumps to $111,111. The table below shows how varying overhead and margin targets affect your Required RPE:
Overhead % | Target Margin % | Required RPE (at $50k Payroll/Employee) |
|---|---|---|
20% | 25% | $90,909 |
25% | 25% | $100,000 |
30% | 25% | $111,111 |
25% | 30% | $111,111 |
Petitpas also advocates for incorporating a buffer into your target:
"If a firm's goal is to get to 25% net profit, they should probably set a target that would get them to 35% if everything went perfectly. As we know, things almost never go perfectly" [3].
If your current RPE is significantly higher than your target - say, $550,000 or more - it may indicate your team is stretched too thin. This can lead to quality issues or missed deadlines, which risk client satisfaction and retention [4]. In such cases, hiring additional staff becomes essential to maintain service quality and avoid burnout.
This framework transforms RPE into a practical tool for decision-making. It not only shows where your agency stands today but also highlights the adjustments needed to meet your profit goals. At StealthCFO, this principle is central to helping agency founders make quicker, more informed decisions. Use these benchmarks as a foundation to refine your hiring and pricing strategies, ensuring every team member contributes to the profitability you need.
Using RPE as a Decision Guardrail
Revenue Per Employee (RPE) isn't just a performance metric - it acts as a decision-making compass for your agency. Think of it as a check engine light for your operations. If RPE dips below $120,000, it’s a red flag that you’re either overstaffed or dealing with inefficiencies that bog down performance [7]. On the flip side, an RPE consistently above $175,000 suggests your team is stretched too thin, risking burnout and declining work quality [7]. The sweet spot between these numbers is where your operational decisions should focus.
A particularly risky moment for RPE comes right after landing a major client. The knee-jerk reaction is often to hire immediately, but adding headcount before the revenue fully materializes can cause a profitability lag - sometimes lasting up to six months as new hires ramp up [5]. Dan Newman, founder of Learn to Scale, captures this perfectly:
Adding more people to a low-RPE environment is like pouring more fuel into a sputtering engine [7].
Before making any hiring decisions, ensure that the additional headcount won’t drag RPE below the acceptable threshold.
When to Hire Based on RPE
RPE gives you a clear signal for hiring decisions, not a rigid timeline. If your RPE consistently exceeds $175,000, it’s a sign to consider expanding your team [7]. On the other hand, if it falls below $120,000, hit pause on hiring and focus on fixing operational inefficiencies - whether that’s addressing approval bottlenecks, cutting down on scope creep, or refining decision-making processes [7].
When hiring becomes necessary, stick to the 4:1 ratio: four billable producers for every one non-billable support or management role [7]. This ratio helps maintain a healthy RPE as you scale. Be cautious about adding non-billable middle management unless the numbers justify the expense. Strong leadership matters here - business units led by capable managers can achieve 27% higher RPE compared to those with weaker leadership [11].
Strategic hiring decisions naturally lead into another critical area: leveraging pricing and utilization to drive growth.
Pricing and Utilization as Levers
If your RPE is stagnant or declining, hiring isn’t the solution. Instead, focus on two levers you control: pricing and utilization. For example, increasing your team’s billable utilization from 65% to 75% can generate an additional $50,000 in revenue for a $500,000 team - all without adding a single new hire [3]. Use your time-tracking data to uncover where high-value employees are losing time to low-value tasks, such as excessive internal meetings, administrative work, or unnecessary client hand-holding. These tasks can often be automated or delegated [1].
Pricing is the quicker lever to pull. If RPE remains sluggish despite achieving 75% utilization, you’re likely underpricing your services. Adjust your rates to better reflect the value you deliver [10]. Consider adopting value-based pricing or retainer models that emphasize outcomes over hours worked. Agencies specializing in high-value niches often achieve RPE figures north of $250,000, while generalist agencies typically hover around $180,000 due to standardized delivery and less differentiated pricing [7].
At its core, RPE measures how effectively your team’s time converts into revenue. If the numbers don’t align, focus on improving pricing strategies before rushing to expand your team.
Improving Revenue Per Employee: CFO-Grade Strategies
Once you've set Revenue Per Employee (RPE) as a key decision-making metric, the next step is creating systems to improve it. This means rethinking operations to generate more revenue from your current team. The focus here is on refining team structures, anticipating trends, and cutting out low-margin work - all with an eye on boosting productivity and profitability.
Optimizing Team Structure for Productivity
How you organize your team directly impacts RPE. According to a 2023 study by Kitces, three-member "Triangle Teams" - consisting of one lead advisor and two support staff - averaged $412,333 in revenue per employee. This was significantly higher than solo practices ($182,500) and two-person teams ($295,000) [12]. However, expanding to a four-person team often reduces revenue per advisor by about $137,000 due to added coordination challenges [12].
The takeaway? Avoid unnecessary team expansion, especially by adding non-billable roles that bog down management and create inefficiencies. For payroll-heavy agencies, this is critical: every non-billable position increases overhead and dilutes RPE.
Instead, consider outsourcing fulfillment to white-label partners. This approach scales your delivery capacity without inflating your in-house headcount, keeping your RPE calculation lean. For example, in 2024, Design du Plume boosted project profitability by 20% by consolidating project management, reporting, and accounting tools into a single platform. This allowed for real-time workload adjustments and data-driven pricing [3]. Similarly, DGA Group saw a 33% jump in project profitability and a 20% increase in employee utilization after adopting a centralized work management system [3].
Once your team is streamlined, monitor RPE trends regularly to adjust your strategy as needed.
Forecasting RPE Trends Over Time
RPE isn’t a static figure - it fluctuates as you hire, adjust pricing, or let staff go. To identify problems early, calculate RPE quarterly rather than annually [4][6]. Use your cost-to-revenue ratio to forecast trends and guide decisions.
For instance, if your overhead is 25% and you aim for a 25% profit margin, an employee with a $50,000 payroll cost needs to generate $100,000 in revenue [3]. If your RPE falls below this level, you’re likely overstaffed or underpricing your services. Marcel Petitpas advises:
If a firm's goal is to get to 25% net profit, they should probably set a target that would get them to 35% if everything went perfectly. As we know, things almost never go perfectly [3].
When hiring, expect a short-term dip in RPE. It can take up to six months for a new hire to reach full productivity, temporarily skewing the metric [5]. To smooth out these fluctuations, calculate RPE using average headcount over time [4].
If your RPE still isn’t improving, it’s worth examining whether low-margin work is dragging you down.
Eliminating Low-Margin Work
Conduct monthly audits of project profit-and-loss statements to identify which projects drive profits and which drain resources [13][15]. Keep an eye on write-offs and scope creep by tracking unbilled hours - frequent issues here often point to inefficiencies or over-serving [13][3].
The PR agency Sweat+Co improved profitability by at least 20% in 2024 by using time-tracking analytics to identify non-billable work. Business Consultant Dax Kimbrough shared:
Toggl Track increased our profitability by at least 20%. We found out where the team was spending too much time. Whether that was us being inefficient or over-serving or working too slowly, Toggl Track gave us the ability to restrategize [1].
Set a delivery margin floor - typically between 55% and 75% - for all new projects [3]. If a client or service consistently falls below this threshold, it may be time to reprice or drop the work altogether. As Greg Hoffman, co-founder of Get Found Fast, explains:
Revenue can trump profit if the client has good upsell potential. If we choose this situation, our goal is to get a relationship going, build trust and proof of work, then the upsell potential for more services and better profit is there [15].
Be cautious of small clients. They can demand up to 90% of your resources while contributing only about 10% of your revenue [14][15]. Use strategies like the "Yes, But" approach to manage scope creep. Instead of outright rejecting out-of-scope requests, respond with: "Of course! Let me get you a quote for that." This ensures additional work is always properly valued [14].
Conclusion: Revenue Per Employee as a Scaling Compass
Revenue Per Employee (RPE) isn’t just another financial metric; it’s a critical decision-making tool that guides when to hire, when to pause, and when to refine your operations. For payroll-heavy agencies, where labor costs dominate expenses and drive value creation, RPE serves as a clear measure of efficiency: are you improving productivity, or simply adding headcount?
To calculate RPE, divide your net revenue by the number of full-time equivalents (FTEs). Then, benchmark your result against industry standards and your internal cost targets. If your RPE consistently exceeds the benchmark, it could mean you’re understaffed - potentially overburdening your team. On the other hand, if it falls below target, it might signal overstaffing, underpricing, or an overreliance on low-margin work. This clarity allows you to take specific, margin-protecting actions as you scale.
Treat RPE as a practical scaling tool, not a vanity metric. Before making hiring decisions or taking on new projects, evaluate whether you can first improve utilization, automate processes, or leverage fulfillment partners to maintain a strong RPE. These adjustments can deliver immediate operational benefits.
If your RPE stagnates or declines as revenue grows, the problem likely isn’t revenue - it’s control. A flat or falling RPE points to deeper operational inefficiencies, such as poor labor productivity or weak project margin oversight. This is your signal to introduce systems that offer real-time visibility into these areas, enabling smarter, faster decisions. The goal is not flawless execution but predictability, giving you the confidence to scale without unnecessary risk.
At StealthCFO, we help agency founders leverage RPE insights through precise financial systems. For example, our 90-Day Financial Control Sprint equips leaders with the tools to minimize risk and scale confidently, ensuring their operations remain aligned with growth objectives.
FAQs
How do I calculate Revenue Per Employee for my agency?
To determine Revenue Per Employee, take your agency's total revenue for a given period - such as annual revenue - and divide it by the average number of full-time equivalent (FTE) employees during that same timeframe. If your team size varies throughout the year, it's better to calculate using the average headcount rather than a single point in time.
For instance, if your agency brought in $5 million last year and maintained an average of 25 FTEs, your Revenue Per Employee would amount to $200,000. This figure provides a clear lens into your team's productivity and highlights areas where scaling might be optimized.
How can payroll-heavy agencies improve their revenue per employee (RPE)?
To boost revenue per employee (RPE) in payroll-heavy agencies, center your calculations on billable full-time staff for a clearer picture of productivity. Drive labor efficiency by setting owner-level financial boundaries and leveraging forward-thinking forecasting tools. Price your services deliberately to ensure payroll costs are fully accounted for and margins remain intact. Rather than expanding your headcount, explore strategic fulfillment partners to scale operations without overextending resources. Maintain strict cash flow discipline by applying frameworks like the Four Forces to safeguard financial stability and profitability.
How does revenue per employee (RPE) impact hiring and operational decisions?
Revenue per employee (RPE) is a key metric for evaluating hiring decisions and operational effectiveness. A drop in RPE often points to overstaffing or inefficient use of resources, signaling the need to either halt hiring or reexamine team responsibilities. On the other hand, a healthy RPE justifies adding new team members, ensuring that each hire contributes to maintaining or improving profitability.
Because RPE quantifies the revenue generated per full-time employee, it shines a light on productivity gaps, inefficiencies, and workflow bottlenecks. Tackling these issues allows agencies to fine-tune their operations, simplify processes, and make more confident decisions rooted in data as they grow.
Related Blog Posts
More Free Tools & Templates
Search for free tools


For now, start where every serious founder does — with control.
© STEALTHCFO 2025 | TERMS & PRIVACY